FIGURE 1.
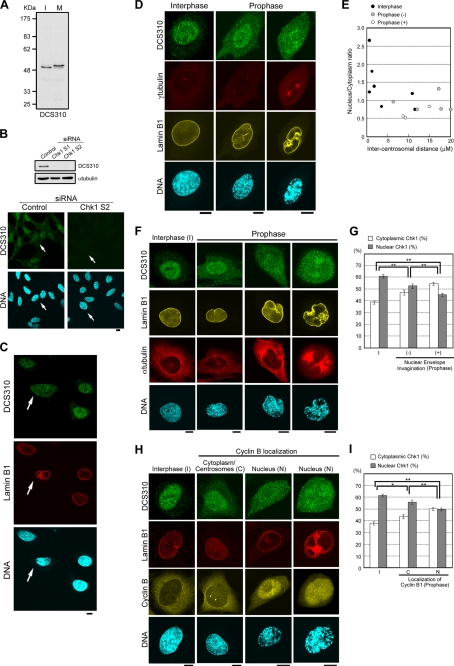
Chk1 is translocated from the nucleus to the cytoplasm in prophase cells. A, interphase (I) and mitotic (M) HeLa cell lysates were subjected to immunoblotting with mouse anti-Chk1 monoclonal antibody (DCS310). B, 48 h after transfection of a siRNA, HeLa cells were subjected to immunoblotting or immunocytochemistry. Arrows indicate prophase cells. Similar diminishment of DCS310 signals upon immunocytochemistry was observed in cells transfected with Chk1 S1 siRNA (data not shown). C–I, shown are confocal microscopic images of HeLa cells stained with DCS310 (Alexa 488-conjugated anti-mouse IgG2b, green). Nuclear membranes (C and H, red; D and F, yellow), mitotic spindles (F, red), cyclin B1 (H, yellow), centrosomes (D, red), and DNA (blue) were simultaneously stained with anti-lamin B1 (Alexa 546- or Alexa 680-conjugated anti-rabbit), anti-α-tubulin (Alexa 680-conjugated anti-mouse IgG1), anti-cyclin B1 (Alexa 546-conjugated anti-mouse IgG1), anti-γ-tubulin (Alexa 680-conjugated anti-mouse IgG1) antibodies and DAPI, respectively. The arrows (C) and arrowheads (H) indicate a prophase cell (C) and centrosomal signals of anti-cyclin B1 antibody (H), respectively. Scale bars = 10 μm. Profiles for intercentrosomal distance (μm) and nucleus/cytoplasm ratios of DCS310 signals in each cell are shown in E. The bar graphs show cytoplasmic or nuclear proportions of DCS310 signals in each cell group (G and I). Prophase cells were divided into two subgroups based on the presence (+)/absence (−) of nuclear membrane invagination (E and G) or the subcellular localization of cyclin B1 (I). Interphase cells are indicated as I (G and I). Each proportion was calculated as described under “Experimental Procedures.” Data represent means ± S.E. for at least 20 cells in each cell group (G and I). *, 0.01 < p < 0.05; **, p < 0.01 (G and I).

