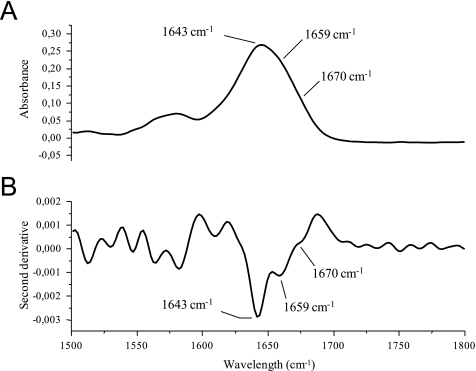
FIGURE 2.
FTIR of the Cx40CT demonstrating a small amount of a dynamic α-helix. A, shown is a FTIR absorption spectrum of the Cx40CT in D2O PBS. B, shown is the second-derivative spectrum of panel A. Bands corresponding to the random coil structure (strong, 1643 cm−1) and dynamic α-helical structure (weak, 1659 cm−1) and turns typically present in dynamic and unfolded proteins (very weak, 1670 cm−1) have been labeled.

