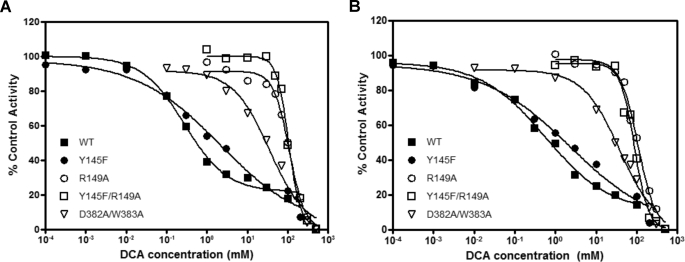
FIGURE 3.
Inhibition of PDK2 basal and E2p/E3BP-dependent kinase activities by DCA. A, inhibition of PDK2 core-free basal activities (without E2/E3BP) by DCA (in a concentration range from 0.1 μm to 500 mm), which is expressed as percentage of control activities (measured without DCA). The phosphorylation reaction was conducted essentially as described in the legend to Fig. 2 except for the inclusion of DCA at different concentrations. Each point represents the average of two independent reactions. B, inhibition of PDK2 core-dependent activities (with 60-meric E2/E3BP) by DCA (in a concentration range from 0.1 μm to 500 mm), expressed as percentage of control activities (measured without DCA). All data were plotted with the GraphPad Prism program.

