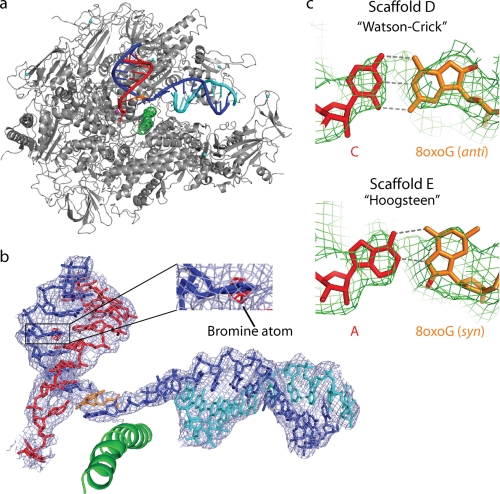
FIGURE 3.
Structures of 8-oxoG-containing pol II ECs. a, overview of the EC D structure. silver, pol II; green, bridge helix; orange, 8-oxoG. b, structure and 2Fo − Fc electron density (blue, contoured at 1.0σ) of nucleic acids in EC E. The anomalous difference Fourier map (red, contoured at 3.5σ) reveals the bromine atom. c, unbiased difference electron density (green, contoured at 2.7σ) for 8-oxoG-containing bp in ECs D (upper) and E (lower).

