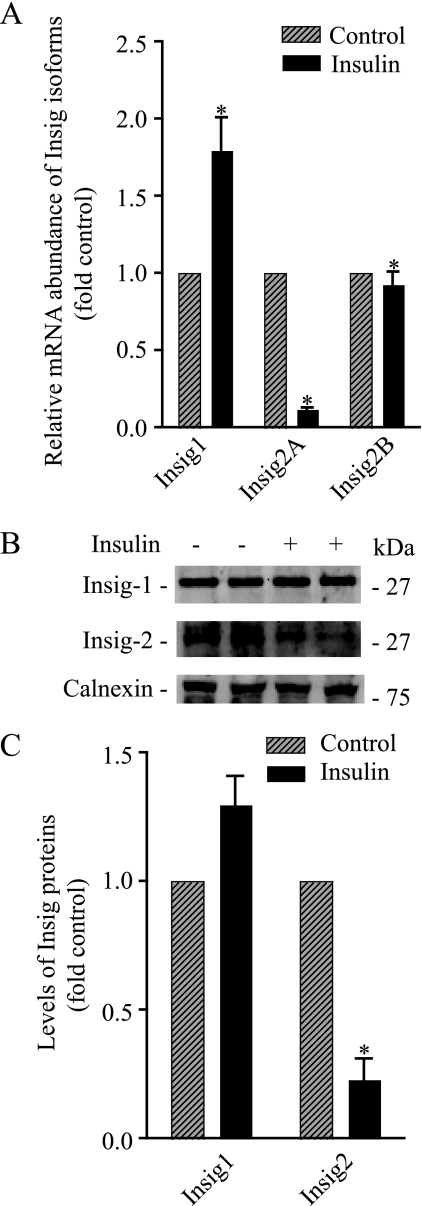
FIGURE 2.
Insulin selectively reduces the levels of Insig2A mRNA and protein. A, primary cultures of rat hepatocytes were treated with and without insulin (100 nm) for 24 h, and RNA was isolated. The mRNA abundance of Insig-1, Insig-2a, and Insig-2b was measured by real-time PCR analysis as described under “Materials and Methods” using 18 S rRNA as the control. The data are expressed as -fold induction of control Insig isoform(s) mRNA abundance. B, hepatocytes were incubated with and without insulin (100 nm) for 24 h, and microsomes were isolated. Microsomal membranes were fractionated by SDS-PAGE and immunoblotted using Insig-1, Insig-2, and calnexin antibodies. Representative blots are shown. C, densitometric quantification of Insig bands from duplicates of three independent experiments as shown in B. The data are expressed as -fold control of Insig specific bands. *, p < 0.05 versus control.

