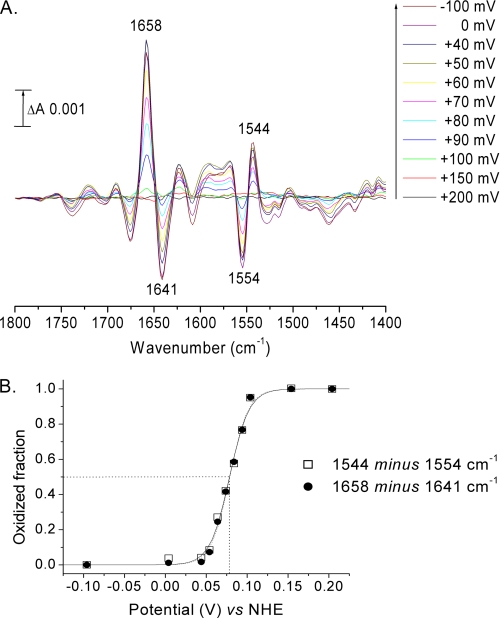
FIGURE 2.
Reductive titration of rTAO. A, difference spectra recorded during a reductive titration in 100 mm potassium phosphate, 100 mm KCl at pH 7.0 (see “Experimental Procedures”). B, plots of peak/trough intensities at 1658/1641 and 1544/1554 cm−1 versus potential. Data were simulated with a Nernst-derived equation for an n = 2 component with E1/2 = 79 mV.

