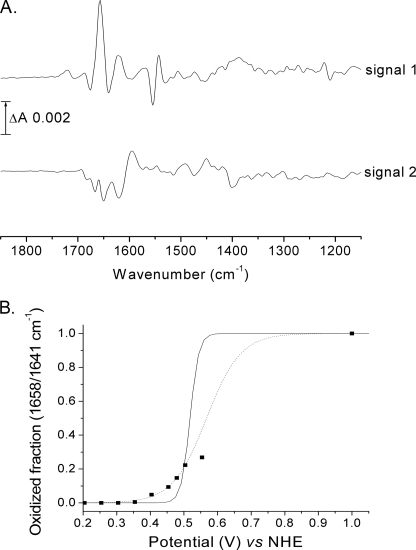
FIGURE 3.
Separation of redox spectra and oxidative titration of signal 1. A, a fully oxidized spectrum was recorded and use as a background. Potential was set to −10 mV, and signal 1 was recorded after 20 min. A new background spectrum was then recorded, and signal 2 was observed to develop at 1 h. B, oxidative titration of signal 1 at pH 7.0 with a mixture of redox mediators containing ferricyanide. Data were simulated with a Nernst-derived equation (see “Experimental Procedures”) for an n = 2 component with E1/2 = 520 mV (solid line) or for an unrestricted fit which gave n = 0.6 and E1/2 = 510 ± 30 mV (dotted line). The maximum intensity of signal 1 was determined by the addition of dioxygen to the fully reduced state.

