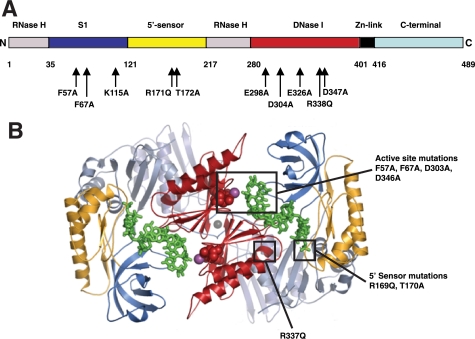
FIGURE 1.
A, schematic map of RNase G. This linear map of RNase G shows the domains inferred from alignment against RNase E. The boundaries are given by the residue numbers below the linear map and correspond to those in RNase E (27). The positions of mutations in RNase G created in this work are noted below the map. B, structure of the N terminus of RNase E. The ribbon diagram was provided by Dr. Ben Luisi and shows the N-terminal region of two monomers of RNase E (27). The positions of substrates (in green) prior to cleavage and the positions of some of the mutations created in this study, are indicated using space-filling atoms. Domains are similarly colored in both A and B.

