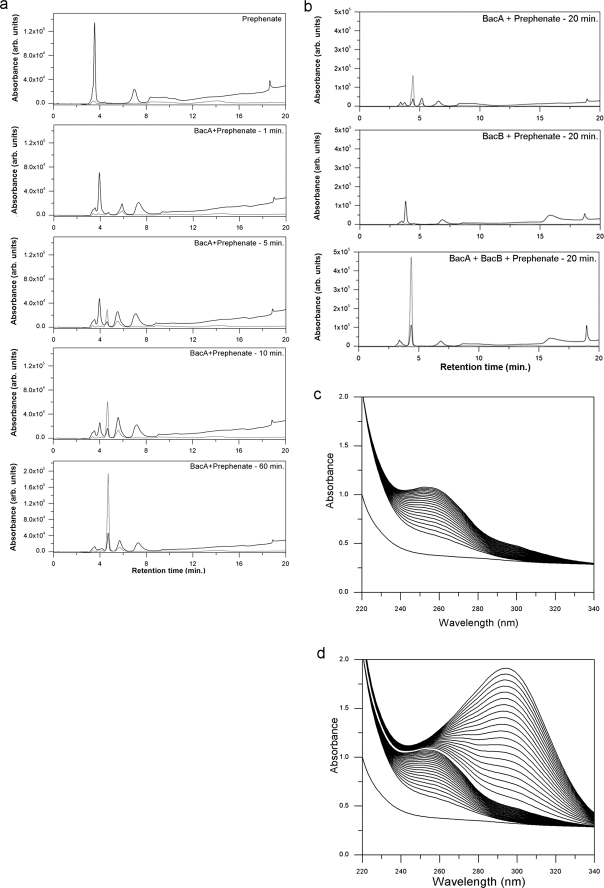
FIGURE 3.
HPLC and UV spectrophotometric studies of the products of BacA and BacB enzymes. a, HPLC elution profiles of the BacA product with prephenate at different time points (1, 5, 10, and 60 min; 220 nm, 280 nm). b, HPLC elution profile of prephenate incubated with BacA alone, prephenate with BacB alone and prephenate with BacA and BacB. c, UV spectrophotometric time course measurement of the catalytic activity of BacA on prephenate. These spectra were recorded at intervals of 30 s. d, UV spectrophotometric time course measurement of the catalytic activity of BacB. These spectra were recorded at intervals of 30 s.

