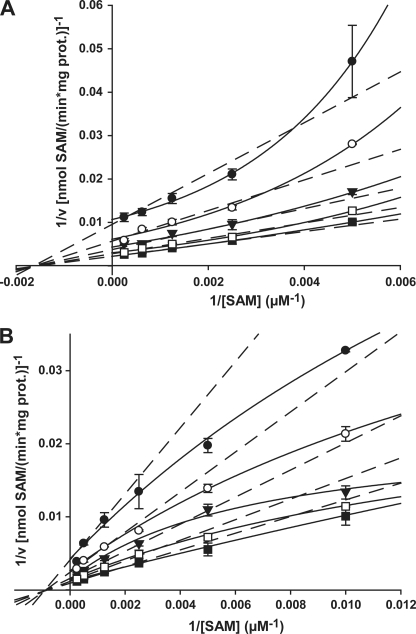
FIGURE 2.
Initial velocity plots for TaPEAMT1 and TaPEAMT2. Both enzymes follow a sequential random Bi Bi mechanism (R2 = 0.975/0.981 for TaPEAMT1/2). A, double reciprocal plot of 1/v versus 1/[SAM] for TaPEAMT1 generated at five fixed P-EA concentrations of 100 (●), 200 (○), 400 (▼), 800 (□), and 2000 μm (■) using 1 μg of recombinant protein (mean ± S.E., n = 2). Whereas plots against 1/[P-EA] are linear (not shown), the plots against 1/[SAM] deviate from a linear relationship (dashed lines) and appear to be parabolic (solid lines). When 1/v is plotted against 1/[SAM]2, the linear relationship is restored confirming that PEAMT has two separate binding sites (napp = 2), which exhibit strong cooperative substrate binding at high [SAM]. B, double reciprocal plot 1/v versus 1/[SAM] for TaPEAMT2 at five fixed P-EA concentrations of 50 (●), 100 (○), 200 (▼), 400 (□), and 1000 μm (■) using 1 μg of recombinant protein (mean ± S.E., n = 2). Both double reciprocal plots show a more hyperbolic scattering of data points, with the deviation from a linear relationship being more pronounced for the plot of 1/v against 1/[SAM]. This suggests a partial negative cooperativity of substrate binding, especially at high SAM concentrations. No forcing or weighting of data points was applied.

