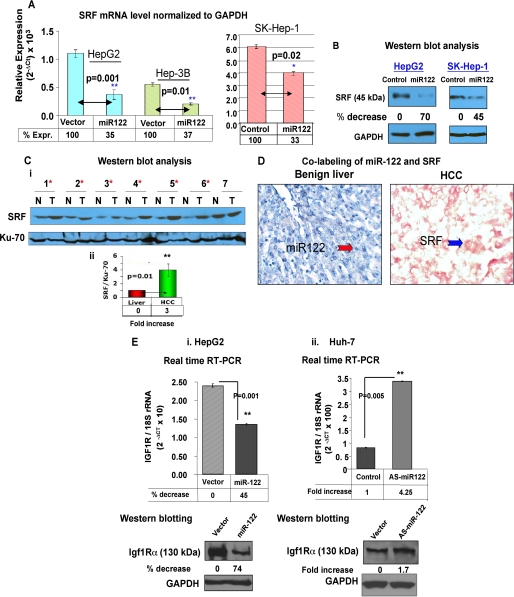
FIGURE 5.
SRF and Igf1R are targets of miR-122. A, SRF mRNA level in HCC cells transfected with (50 nm) control RNA or mimetic (HepG2, Hep3B, and SK-Hep-1) was measured by real time RT-PCR, and the data were normalized to GAPDH. B, SRF protein level in HCC cells expressing miR-122. Western blot analysis of SRF and GAPDH in extracts of cells transfected with control or miR-122 mimetic (50 nm). C, panel i, Western blot analysis of SRF in HCCs and matching liver tissues. Whole tissue extracts were subjected to immunoblot analysis with SRF and Ku-70 antibodies. The asterisks denote samples showing up-regulation of SRF. Panel ii, SRF level normalized Ku-70 level. D, co-labeling of miR-122 and SRF in FFP sections of primary human HCC. Tissue sections were hybridized to biotinylated and LNA-modified antisense miR-122 probe, which was captured with alkaline phosphatase conjugated-streptavidin, and the signal (blue) was developed with nitro blue tetrazolium/5-bromo-4-chloro-3-indolyl phosphate. Next, the section was subjected to immunohistochemistry with anti-SRF antibody using fast red dye as the chromogen. E, expression of Igf1R RNA (upper panels) and protein (lower panels) in cells transfected with miR-122 (in HepG2, panel i) or anti-miR-122 (in Huh-7, panel ii) by real time RT-PCR and Western blot analysis, respectively.

