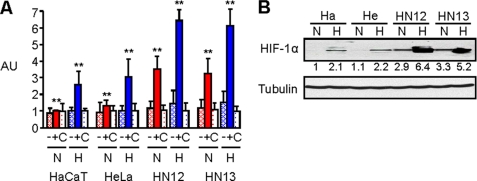
FIGURE 1.
HNSCC cells exhibit high levels of HIF-1α protein and HIF-1 transcriptional activity. A, HaCaT, HeLa, HN12, and HN13 cells were electroporated with a luciferase reporter plasmid containing a mutated (−) or wild-type (+) VEGF promoter, or control DNA (C) and subjected to a luciferase assay measuring fluorescence (arbitrary units, AU, normalized with Renilla) following exposure to normal tissue culture conditions (normoxia- N) or an atmosphere of 1% oxygen overnight (hypoxia- H). Student's t tests were performed comparing HN12 and HN13 expressing the wild-type luciferase reporter in normoxia and hypoxia with HaCaT and HeLa under identical conditions, and p values calculated (**, p ≤ 0.01). B, immunoblot for HIF-1α (upper panel) in the indicated HNSCC cell lines, HaCaT (Ha) and HeLa (He) cells, in normoxia or hypoxia. Protein levels are quantified below the immunoblot as a fold-increase relative to HaCaT cells in normoxia. Tubulin is used as the loading control (lower panel).

