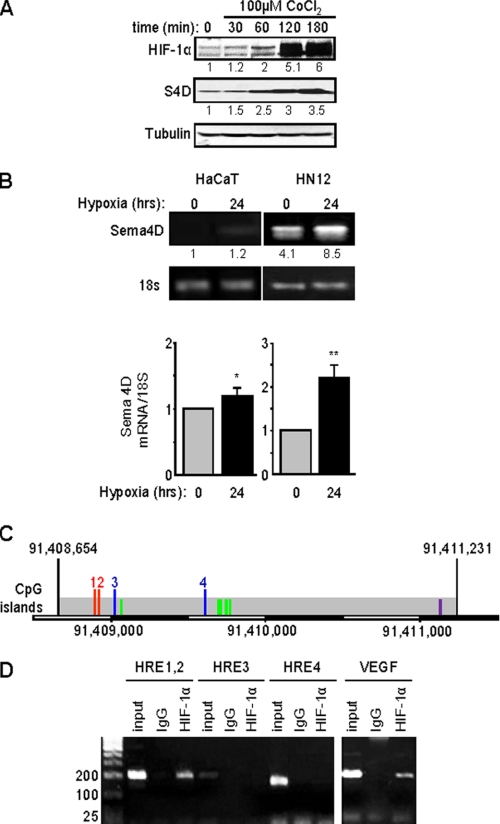
FIGURE 2.
Expression of Sema4D protein and mRNA are elevated in HNSCC cells and strongly induced in hypoxia. A, HN12 cells exhibit increasing levels of Sema4D (S4D, middle panel) when exposed to the hypoxia-mimetic CoCl2, a response correlated with increasing levels of HIF-1α (upper panel). Protein levels are quantified below each blot as a fold-increase relative to untreated cells. Tubulin is used as the loading control (lower panels). B, HaCaT cells (left panel) and HN12 (right panel) were cultured under normal conditions or hypoxia for 24 h, and total RNA was extracted to detect steady-state Sema4D transcripts in a quantitative conventional PCR analysis. Band intensities are quantified below each image as a fold-increase relative to untreated HaCaT cells. Housekeeping 18S mRNA was used as a control. The bar graph represents the ratio of Sema4D mRNA to 18S mRNA for real time PCR from three independent experiments. Student's t tests were performed for HaCaT and HN12 in hypoxia, compared with normoxia, and p values calculated (*, p ≤ 0.05; **, p ≤ 0.01). C, potential Sema4D promoter region. Predicted TSS within a region of CpG islands are indicated by the green lines. The first two HRE present, which conform to the expanded sequence 5′-BRCGTGVBBB-3′ (where B is C, G, or T, R is G or A, and V is A, C, or G) are numbered 1 and 2 (red lines). Two other HRE, which contain the core sequence 5′-RCGTG-3′, are numbered 3 and 4 (blue lines). An AP-1 site conforming to the sequence 5′-TGASTCA-3′ (where S is G or C) is shown in purple. The scale bar at the bottom shows the nucleotide number on the reverse strand of chromosome 9. D, ChIP assay. Chromatin lysates from HN12 cells exposed to hypoxic conditions were immunoprecipitated with anti-HIF-1α antibodies. Purified, fragmented DNA was subjected to PCR with a set of primers to HRE 1 and 2 (done together due to their close proximity), HRE 3 and HRE 4, as indicated in C, or for the VEGF promoter as a positive control (right panel) followed by gel electrophoresis. HIF-1 binding to HRE 1 and 2 is observed in HN12 cells exposed to hypoxic conditions. Input represents the PCR products from purified DNA fragments alone. Rabbit IgG was used as the negative control for HIF-1α immunoprecipitation (IgG). Size markers are shown on the left.

