FIGURE 5.
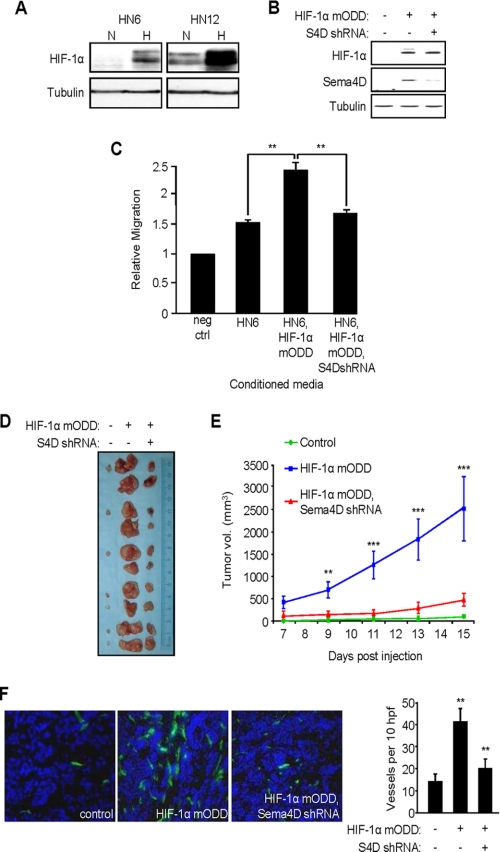
Sema4D knockdown reduces HIF-1α-induced tumor growth and vascularity. A, immunoblot shows greater levels of HIF-1α in normoxia and an increase in hypoxia in HN12 compared with HN6 (upper panel). Tubulin was used as a loading control (bottom panel). B, immunoblot analysis for HIF-1α (top panel) and Sema4D (middle panel) in HN6 cells co-infected with control lentiviruses (HIF-1α mODD: −; Sema4D shRNA: −), lentivirus coding for HIF-1α mODD (+) and control lentivirus (Sema4D shRNA: −), or lentivirus coding for Sema4D shRNA (+) and HIF-1α mODD (+). Tubulin was used as a loading control (bottom). C, medium conditioned by HN6 cell populations infected with control lentiviruses (HN6), HIF-1α mODD-expressing and control lentivirus (HN6, HIF-1α mODD), or Sema4D shRNA and HIF-1α mODD virus (HN6, HIF-1α mODD, S4D shRNA) were used as chemoattractants for HUVEC cells in an in vitro migration assay. Migration was scored relative to that seen in negative control wells (0.1% BSA, neg ctrl). Student's t tests were performed comparing migration seen in medium conditioned by HN6 expressing HIF-1α mODD with control HN6 and those co-expressing Sema4D shRNA, as shown, and p values calculated (**, p ≤ 0.01). D, representative tumors derived from HN6 cells infected with control lentiviruses or lentiviruses expressing the HIF-1α mODD construct with or without co-infection with virus expressing Sema4D shRNA, shown at the time of harvesting. E, quantification of tumor volume results from C from day 7–15 post-engraftment of the three populations of cells. Student's t tests were performed, post day 9, comparing growth of HIF-1α mODD-expressing tumors with those co-expressing Sema4D shRNA, as shown, and p values calculated (**, p ≤ 0.01; ***, p ≤ 0.001). F, CD31 stain of frozen sections of tumors derived from HNSCC cells infected with control lentiviruses (left panel), HIF-1α mODD-expressing lentivirus (middle panel), and HIF-1α mODD and Sema4D shRNA lentiviruses (HIF-1α mODD, S4D shRNA, right panel). Quantification of the number of vessels per 10 high-power fields in CD31-stained xenografts is shown in the bar graph (right). Student's t tests were performed, comparing the number of blood vessels from tumors expressing HIF-1α mODD to numbers seen in those co-expressing Sema4D shRNA, and p values calculated (**, p ≤ 0.01; ***, p ≤ 0.001).

