FIGURE 6.
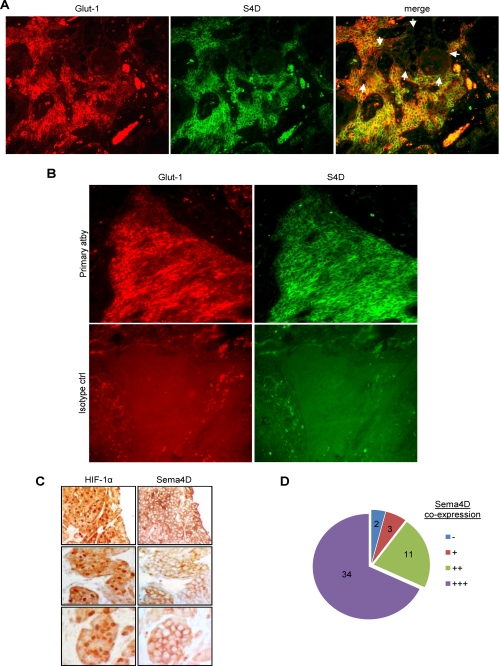
Immunofluorescence and immunohistochemistry for Glut-1, Sema4D, and HIF-1α in HNSCC. A, Glut-1 expression (Glut-1, red, left column) and Sema4D expression (S4D, green, middle panel) occur in the same cells and in the same areas of tumor (merge, in yellow, right panel). In areas lacking Glut-1 expression, Sema4D is also not expressed (merge, right panel, indicated by white arrows). B, co-immunofluorescence in HNSCC biopsy specimens for Glut-1 (left) and Sema4D (right). Fluorescence in samples processed with the primary antibodies (top row) indicates specificity when compared with isotype control antibodies (bottom row). C, immunohistochemistry in serial sections of HNSCC biopsy specimens for HIF-1α (left column) and Sema4D (right column) demonstrate expression in the same cells and in the same areas of tumor. D, 50 hpf from 5 HNSCC exhibiting expression of nuclear HIF-1α in immunohistochemistry were examined in serial sections for co-expression of Sema4D. 34 cases demonstrated very strong Sema4D co-expression (+++) and 11 showed strong expression (++). 3 areas weakly expressed Sema4D (+) while 2 areas showing HIF-1α had little to no corresponding Sema4D (−).

