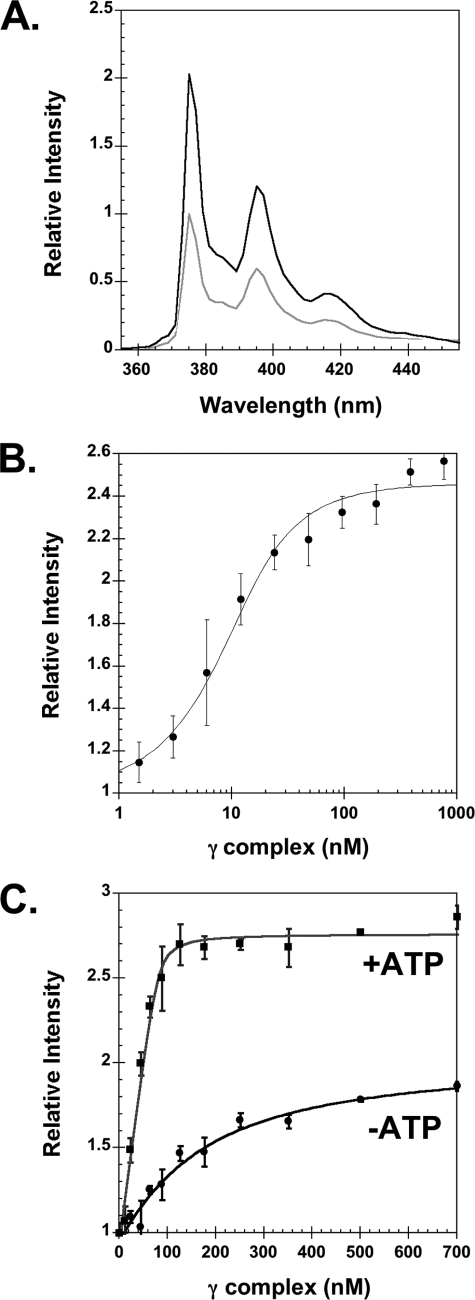
FIGURE 2.
Equilibrium binding of γ complex to β. A, emission spectra of βPY were taken at excitation wavelength of 345 nm. The light gray trace is a scan of free βPY and the black trace is after the addition of γ complex and ATP. Final concentrations were: 80 nm βPY, 240 nm γ complex, and 0.5 mm ATP. B, equilibrium binding of γ complex to β was determined by measuring the intensity of PY as a function of γ complex concentration, where γ complex was titrated into βPY solutions in assay buffer containing ATP. Final concentrations were: 10 nm βPY and 0.5 mm ATP in assay buffer. C, stoichiometric binding of γ complex to β was measured in the absence (circles) and presence (squares) of ATP. The γ complex and ATP were added sequentially to a solution of βPY in assay buffer. The relative intensity of PY at 375 nm is plotted as a function of γ complex concentration. Final concentrations after the addition of ATP were 80 nm βPY and 0.5 mm ATP in assay buffer.

