FIGURE 3.
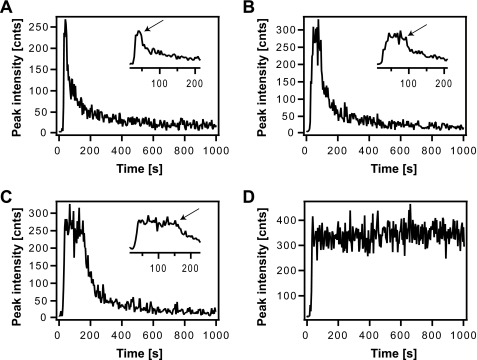
Examples of single Syb1–116 vesicle docking and fusion events to acceptor SNARE complex-containing planar-supported membranes (467 acceptor complexes/μm2). Peak fluorescence intensities from each vesicle are plotted as function of time. Time zero is arbitrary for each observed event. The onset of docking time is defined as the mid-point of the sharp rise of each time course. The onset of fusion time is defined as the time (arrows in expanded insets) when the fluorescence begins to decay to almost zero within a second. Lag times (Δtfus) between docking and fusion were 20 (A), 40 (B), and 120 ms (C) for the three vesicles that fused. The vesicle shown in D docked but did not fuse.

