FIGURE 5.
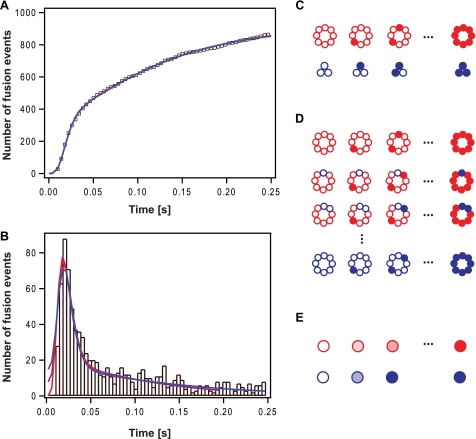
Fusion kinetics of single vesicle SNARE fusion. A, cumulative distribution function of 863 analyzed single Syb1–116 vesicle fusion events to acceptor SNARE complex-containing planar membranes at a density of 467 acceptor complexes/μm. B, corresponding histogram of fusion times with a bin size of 4 ms. The data were fitted with three different fusion site models (see text). Magenta line, two fusion site model (Model 1); red line, mixed fusion site model (Model 2); blue line, sequential fusion site model (Model 3). C–E, graphic representation of the three models that were tested to interpret the single vesicle fusion kinetic data. The following symbols are used to describe all models: open circles, inactive complex; filled circles, active complex; red color, fast fraction; blue color, slow fraction. C, two fusion site model (Model 1): two distinct fusion sites (red and blue) that are each composed of different numbers of particles that are activated randomly at different rates (open-to-filled transition). D, mixed fusion site model (Model 2): fusion sites are composed of a fixed total number of particles but may contain different numbers of fast (red) and slow (blue) randomly activating particles. E, sequential fusion site model (Model 3): two distinct fusion sites with different numbers of particles that are activated sequentially with the same rate within the same class (red or blue) but different rates between the two classes (red and blue).

