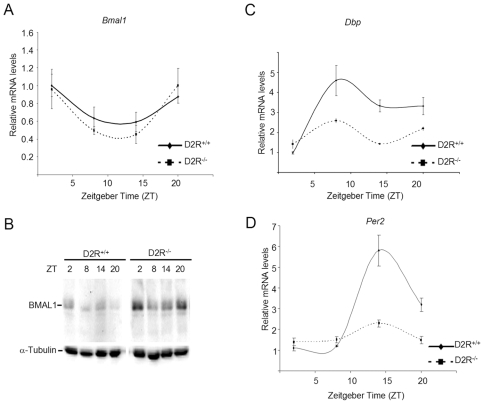
Figure 5. BMAL1 mRNA and protein levels in WT and D2R−/− mice.
Mice entrained in 12 hr Light – 12 hr Dark cycles were sacrificed at indicated times and their striatum was dissected out. (A) RNA was prepared at indicated times, reverse transcribed, and real-time PCR was performed using primers for Bmal1 and 18S rRNA. Data is represented as relative levels of Bmal1 normalized to 18S rRNA. (B) Total lysates were prepared and resolved by SDS-PAGE. BMAL1 and α-tubulin levels were detected by Western analysis using specific antibodies. (C,D) Same as in (A), except real-time PCR was performed using primers for (C) Dbp and (D) Per2.

