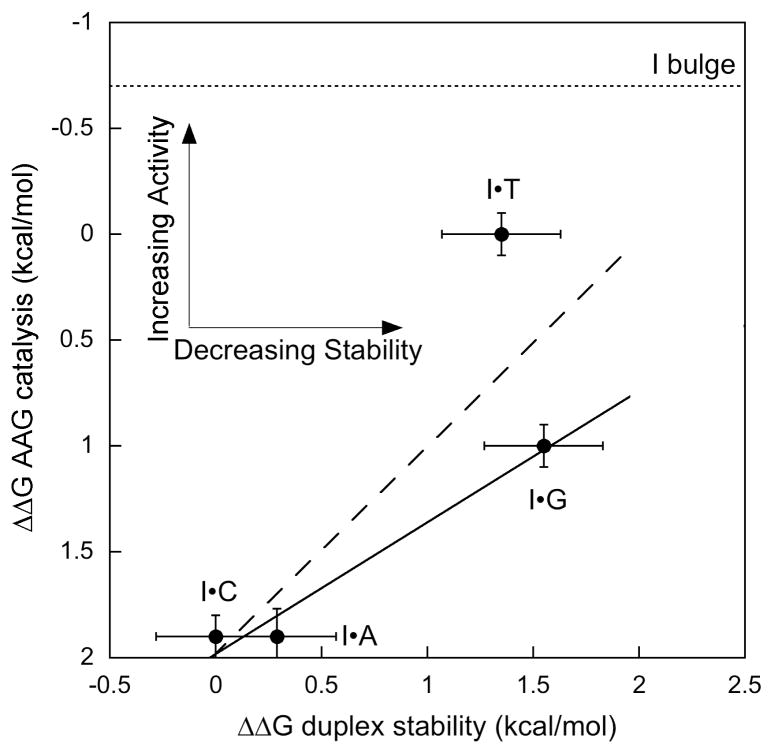
Figure 3.
Linear free energy relationship shows an inverse correlation between duplex stability and glycosylase activity. Differences in free energy (ΔΔG) are from ref 7 for duplex stability and from the equation ΔΔG = −RTln(kcat/KMrel) for AAG activity. Linear fits to all of the mismatches (dashed line; slope = −0.97; R2 = 0.67) or with the exclusion of the T mismatch (solid line; slope = −0.59; R2=0.97) are shown. The relative activity towards a bulge is shown as a dotted line.

