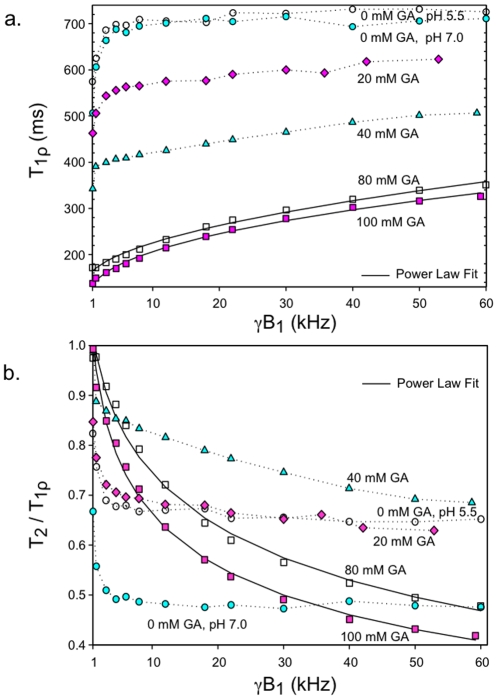
Figure 2. T1ρ dispersion characteristics of various protein solutions.
(a) T1ρ of water protons in solutions of 10% BSA (fraction V) versus B1 field strength at various glutaraldehyde (GA) concentrations. Samples were evaluated at 2T. Uncrosslinked BSA samples were studied at pH 5.5 and 7.0. The data points for 80 and 100 mM GA were fitted to the relaxation-time power law of Eq. [1]. (b) T2 measurements were incorporated into the data of panel a to show T2/T1ρ ratios as a function of B1 field strength. See text for details.

