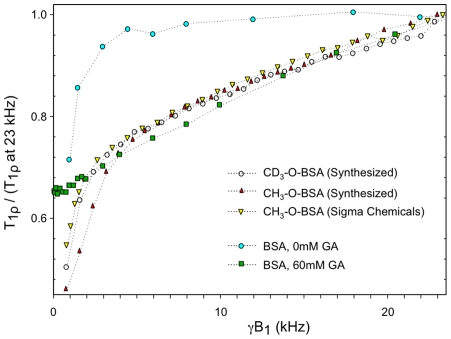
Figure 5. Normalized T1ρ dispersion plots of methylated BSA solutions.
Samples were evaluated at 2T. Plots of native and crosslinked BSA (fraction V) are also shown for comparison. Note the similarity of T1ρ dispersion of methylated BSA with crosslinked BSA above 5 kHz, and the similarity with native BSA below 5 kHz.

