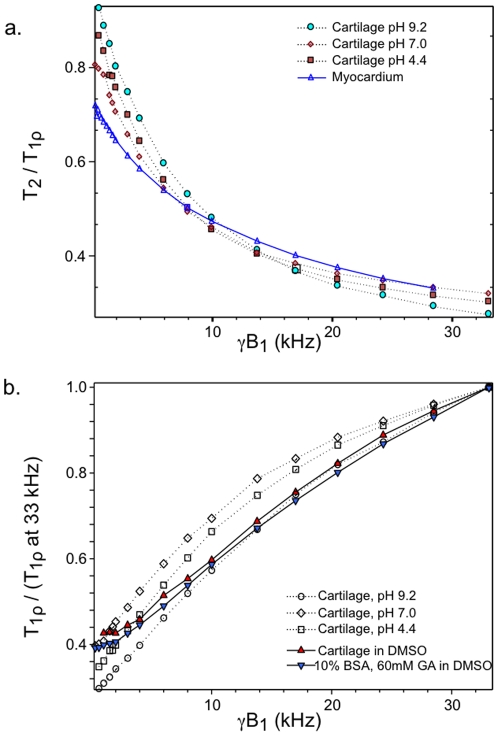
Figure 6. T2/T1ρ ratio as a function of B1 field strength (a) and normalized T1ρ dispersion plots (b) of various tissue samples.
Calf patella cartilage at various pH and rat myocardium samples were evaluated at 2T. Plots of cartilage and crosslinked BSA (fraction V) in DMSO solvent are also shown for comparison in panel b. See text for details.

