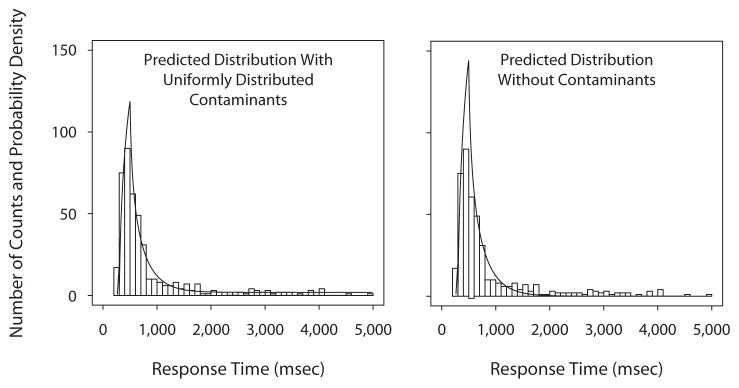
Figure 5.
Response time (RT) distributions for the participant with the most estimated contaminants. Five numerosity categories are grouped (see the text). The left panel shows the predicted RT distribution with the contaminant assumption of uniform random guesses, and the right panel shows the predicted RT distribution without the contaminant assumption, but with the same parameter values as in the left panel. The assumption of uniform random guesses produces an RT distribution tail that adequately describes the data.

