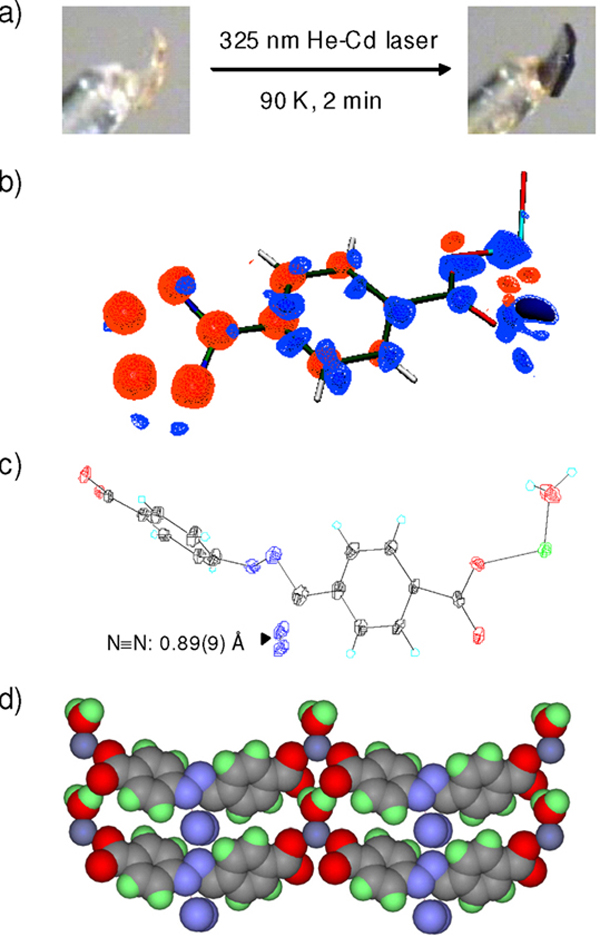
Figure 3.
Photocrystallography of Zn-tetrazole 3 complex: (a) Color change of the crystal upon laser exposure. (b) Photodifference map based on the Fo,(after)-Fo (before). Blue, 2.0; light blue, 1.0; orange, −1.0; red, −2.0 e/A3. Only one half of the map is shown because of the 2-fold symmetry. (c) ORTEP representation of the geometry-refined nitrile imine structure. (d) Packing of the nitrile imines and molecular N2 in the crystal lattice. The N≡N bonds are perpendicular to the plane of view.

