Fig. 4.

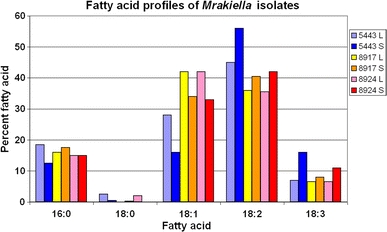
Graph of the fatty acid profile for Mrakiella aquatica (CBS 5543T) and Mrakiella niccombsii (CBS 8917T and CBS 8924). Key refers to CBS numbers; cells were grown and harvested in exponential growth phase (L) and in stationary phase (S)

Graph of the fatty acid profile for Mrakiella aquatica (CBS 5543T) and Mrakiella niccombsii (CBS 8917T and CBS 8924). Key refers to CBS numbers; cells were grown and harvested in exponential growth phase (L) and in stationary phase (S)