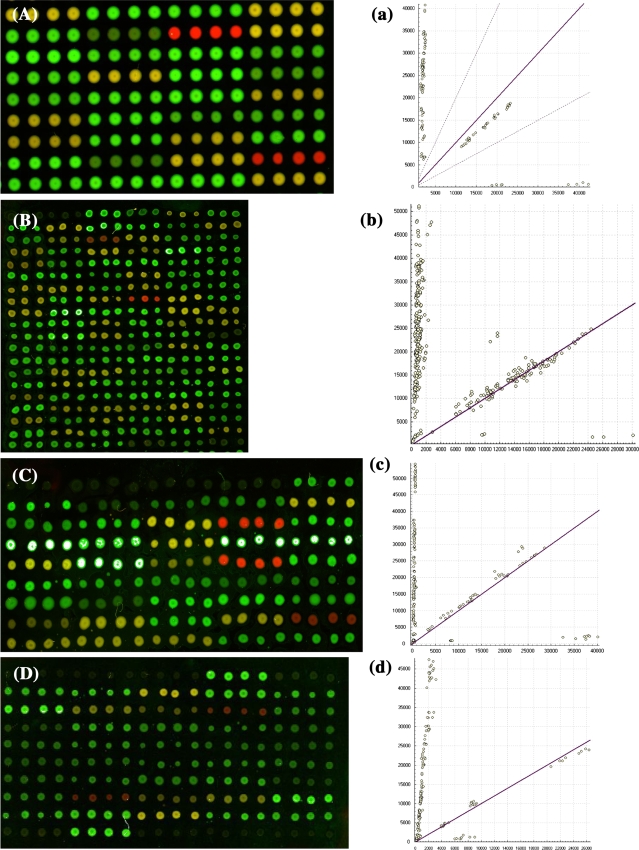
Fig. 1.
Microarray hybridization scanning patterns of SNPs genotyping. A, B, C and D the microarray images of locus MRP2 C-24T, MRP2 Val417Ile, MRP2 Ile1324Ile and GSTP1 Ile105Val; green, yellow and red represent wild, hybrid and mutation type, respectively. a, b, c and d the corresponding scatter plots of A, B, C and D showing the genotype assignment. Each scatter spot shows the signal intensities from each sample without correction for the average local background signal from the microarrays. The scatter spots close to the longitudinal (y) axis indicate the wild homozygote and those close to the lateral (x) axis indicate the mutational homozygote. The spots far from the x axis and the y axis indicated the heterozygote

