
Figure 2.
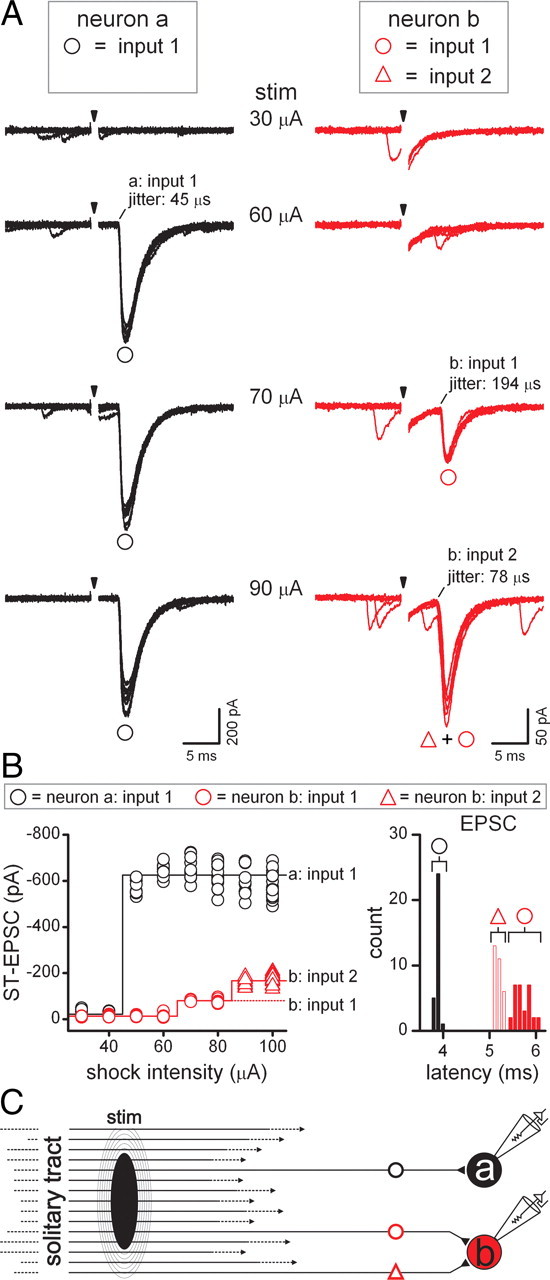
Shocks to the ST most often evoked low-jitter (<200 μs) EPSCs that indicated a monosynaptic pathway to second-order NTS neurons. A, Representative traces recorded simultaneously from a pair of neurons, “a” (black traces) and “b” (red traces). The panel displays eight trials overlaid (shock artifact blanked) at several ST shock intensities (arrows). Low intensities (30 μA) elicited no synaptic responses. Note the presence of spontaneous synaptic events. At 60 μA, shocks evoked low-jitter EPSCs in neuron “a,” designated input 1 (black circle). No ST-evoked EPSCs were elicited in neuron “b” at 60 μA. At 70 μA, shocks evoked EPSCs from input 1 (black circle) in neuron “a” but also activated low-jitter EPSCs in neuron “b” (input 1, red circle). Each 90 μA shock triggered both input 1 in neuron “a” as well as compound EPSCs (red triangle plus red circle) in neuron “b,” consisting of input 1 (red circle) and an additionally recruited input 2 (red triangle) that arrived earlier, exhibited lower jitter, and resulted in a greater amplitude EPSC than input 1 alone. Thus, stimulus recruitment protocols successively activated synaptic inputs to each neuron where each had unique threshold, latency, jitter, and amplitude characteristics. At suprathreshold intensities, synaptic failures were nonexistent. B, Each synaptic input could be identified from a plot of ST-EPSC amplitude plotted versus shock intensity (left panel): the stimulus recruitment profile. Note that the amplitude of input 1 in neuron “a” (black circle) was unaltered by increases in stimulus intensity: an all-or-none or “unitary” profile. In neuron “b,” the latency of input 2 (red triangle) was shorter than the lower threshold input 1 (red circle) as depicted in the histograms of event latencies (right). Latency jitter of <200 μs indicated a direct monosynaptic path between the stimulating electrode and neurons. C, Proposed wiring diagram for the pathways connecting ST afferents to these two neurons. The stimulating electrode (black ellipse) covers most of the ST fiber bundle. Increased shock intensities expand the stimulus (stim; concentric ellipses). With maximal activation, neuron “a” received only one ST-activated input, via a direct monosynaptic pathway (black circle). Neuron “b” (red) was contacted directly by two convergent ST axons (red circle and red triangle). To better appreciate the trial-by-trial dynamic nature of recruitment, as well as the intermittent presence of spontaneous EPSCs, see supplemental Figure 1, available at www.jneurosci.org as supplemental material, for a dynamic GIF of the stimulus recruitment protocol and interpretation of the results. The display includes ST-EPSCs recorded in each neuron recorded for each trial. The intensity meter shows the shock strength and the recruitment curve registers the peak amplitudes for the evoked events. The later panel overlays all trials and shows circuit diagrams for the response-based pathways.