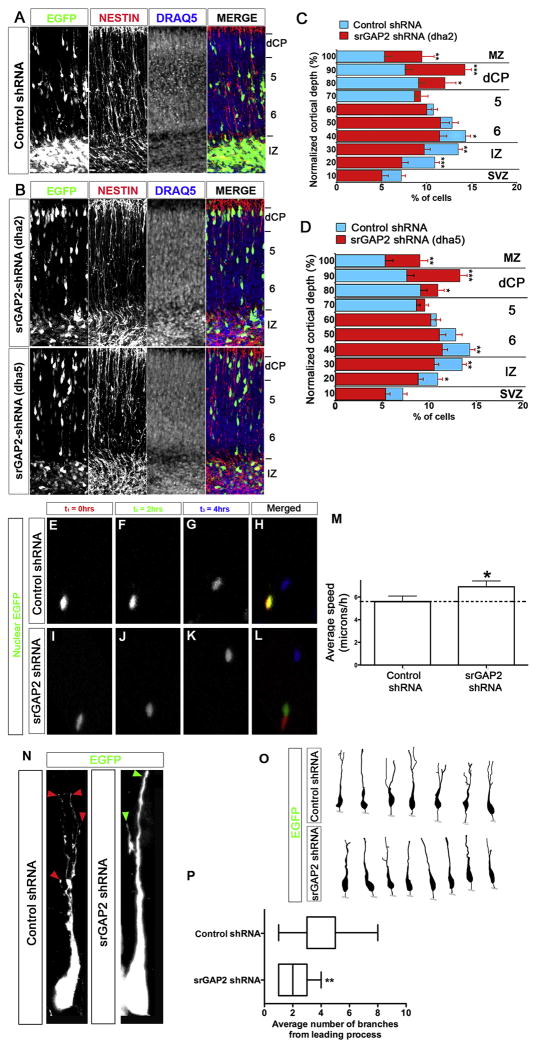
Figure 5. Knockdown of srGAP2 promotes neuronal migration and reduces leading process branching.
(A) E15 cortical slices cultured for 3 days after electroporation with EGFP + control shRNA. Slices were stained with anti-Nestin antibody revealing radial glial scaffold and Draq5 to illustrate cytoarchitecture.
(B) E15 cortical slices cultured for 3 days after electroporation with EGFP + Dha2 (B, top panel) or Dha5 (B lower panel). Slices were stained with anti-Nestin antibody revealing radial glial scaffold and Draq5 to illustrate cytoarchitecture.
(E–L) E15 cortical slices cultured for 2 days ex vivo after electroporation with Nuclear EGFP (3NLS) along with control shRNA (E–H) or srGAP2 shRNA (I–L) were imaged using time-lapse confocal microscopy. Neurons transfected with srGAP2 shRNA undergo faster translocation within 4 hrs (I–L and no colocalization in L) than control shRNA-transfected neurons.
(M) Quantification of effects of srGAP2 knockdown on cell speed. Neurons with reduced level of srGAP2 (shRNA) migrated approximately 23% faster (6.91 μicrons/h compared to 5.59 μicrons/h) compared to control shRNA-transfected neurons. Control shRNA, n=95 cells; srGAP2 shRNA n=84. Cells were taken from 3 independent experiments. Mann-Whitney Test * p<0.05; ** p<.001; *** p<0.001.
(N–O) High magnification images (N) and reconstructions (O) of control shRNA (left panel) or srGAP2 shRNA (right panel) expressing neurons in layers 5/6. Note the branched morphology of the leading process of control shRNA expressing neurons (red arrowheads pointing to leading process tips in N) whereas srGAP2 shRNA expressing neurons displayed a simpler, less branched morphology (green arrowhead in N pointing to single leading process tip).
(P) Quantification of the leading process branch number in control shRNA or srGAP2 shRNA expressing neurons. Control shRNA, n=19 cells; srGAP2 shRNA n=17 cells. Cells were taken from 3 independent experiments. Mann-Whitney Test * p<0.05; ** p<.001; *** p<0.001.

