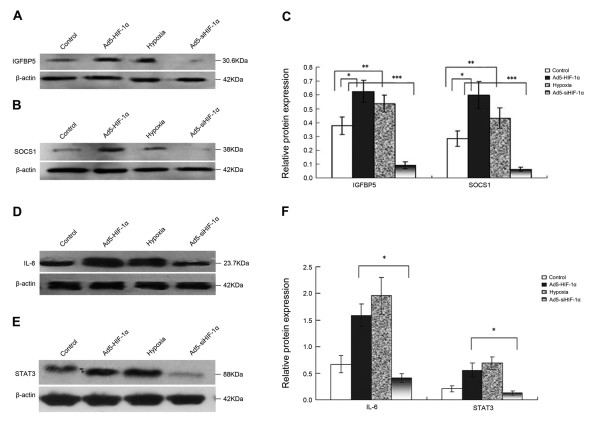
Figure 3.
Western blot analysis of regulation of protein expression by HIF-1alpha in NCI-H446 cells. According to different treatments, all the cells were divided into four groups: control group (the cells cultured under normoxic conditions of 20% O2), Ad5-HIF-1alpha transfection group, hypoxia group (the cells cultured under normoxic conditions of 1% O2) and Ad5-siHIF-1alpha transfection group (after transfection, the cells were cultured under normoxic conditions of 1% O2). (A) Western blot analysis for IGFBP5 protein expressed by the cells of four groups. (B) Western blot analysis for SOCS1 protein expressed by the cells of four groups. (C) Densitometric analysis of the IGFBP5 and SOCS1 bands compared to the corresponding β-actin bands (*p < 0.05 expression of IGFBP5 or SOCS1 protein in Ad5-HIF-1alpha group vs. control group; ** p < 0.05 expression of IGFBP5 or SOCS1 protein in hypoxia group vs. control group; *** p < 0.05 expression of IGFBP5 or SOCS1 protein in Ad5-siHIF-1alpha group vs. control group). (D) Western blot analysis for IL-6 protein expressed by the cells of four groups. (E) Western blot analysis for STAT3 protein expressed by the cells of four groups. (F) Densitometric analysis of the IL-6 and STAT3 bands compared to the corresponding β-actin bands (*p < 0.05 expression of IL-6 or STAT3 protein in Ad5-HIF-1alpha group vs. Ad5-siHIF-1alpha group group.)

