
Figure 1.
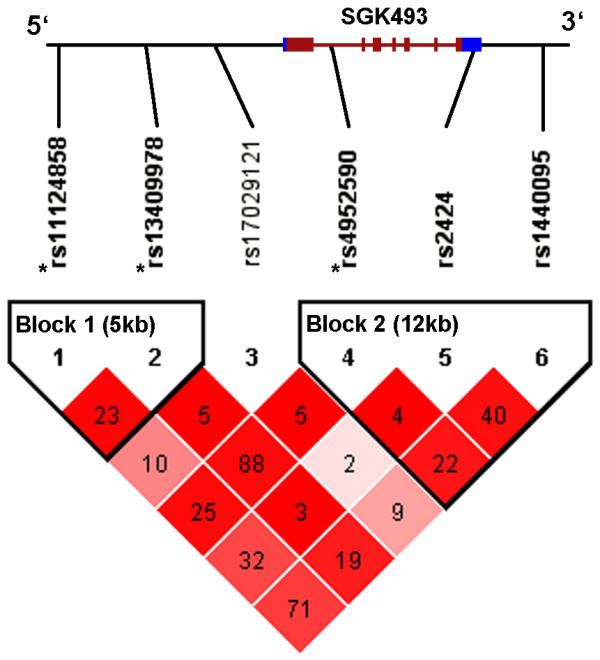
Linkage disequilibrium pattern and haplotype blocks of SNPs in the SGK493 gene using genotyping data in this study. Colors correspond to D' and numbers in each cell to r2 parameter. Blocks were defined with method described by Gabriel et al. [18]. In red is marked the coding region of the SGK493 gene (lines are introns and boxes exons) and blue boxes show the untranslated (UTR) regions of the gene. * SNPs found associated in the individual pooled samples and replication sample (Table 3).