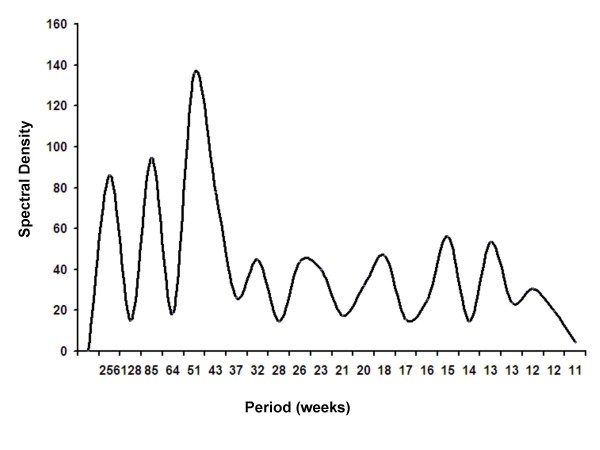
Figure 1.
Periodogram Constructed from Spectral Decomposition of Weekly Pneumococcal Case Counts. Spectral density is represented on the y-axis, and can be conceptualized as a measure of goodness-of-fit for oscillatory regression models at different frequencies. The large peak at a frequency of 51 weeks suggests that invasive pneumococcal disease is a process that oscillates with annual periodicity (and is, in other words, compatible with wintertime seasonality). The two peaks at lower frequencies are lower harmonics illustrating bi- and tri-annual behaviour.

