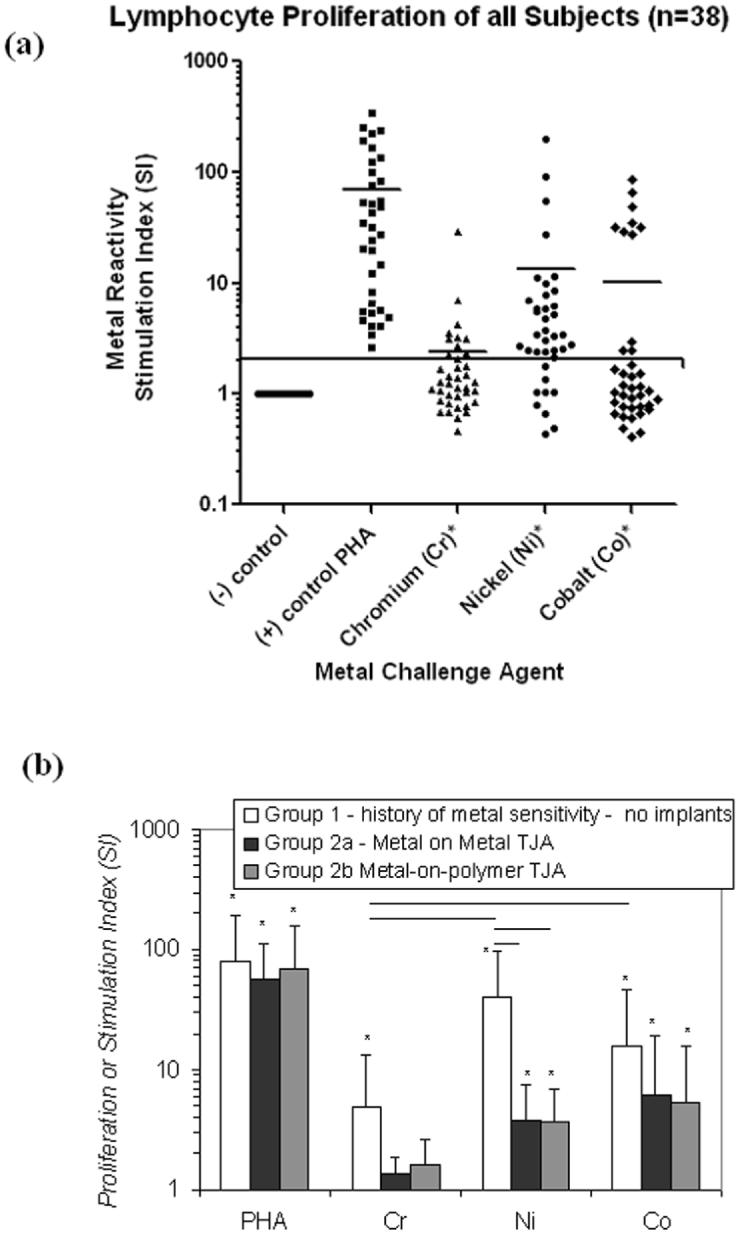
Figure 1.

(1a) All subjects proliferation values in responses to Cr, Ni and Co are shown, where an SI >2 was considered positive for metal reactivity. Reactivity to Co is demonstrably bimodal with high or low reactors that are not subject of any one group tested but are comprised of Groups 1 and 2. Negative controls are shown as a line at SI=1 to underscore that the stimulation index represents normalized data that facilitates compilation, group comparison and comparison to threshold values of high proliferation (e.g. SI>8 = high reactivity) of different individuals within a group. However, statistical comparison was based on paired t-testing of raw cpm proliferation data. (1b) The averaged proliferation responses of metal challenged subjects in Groups 1 and 2 are shown. There were no intergroup differences in reactivity to PHA (a lymphocyte mitogen). Group 1 subjects with THA demonstrated elevated reactivity to Cr (p<0.05) with respect to Group 2a and 2b. Group 1 subjects demonstrated significantly elevated responses to Ni (p<0.02) with respect to Group 2a and 2b. Note: An * = p<0.05, t-test compared to untreated controls.
