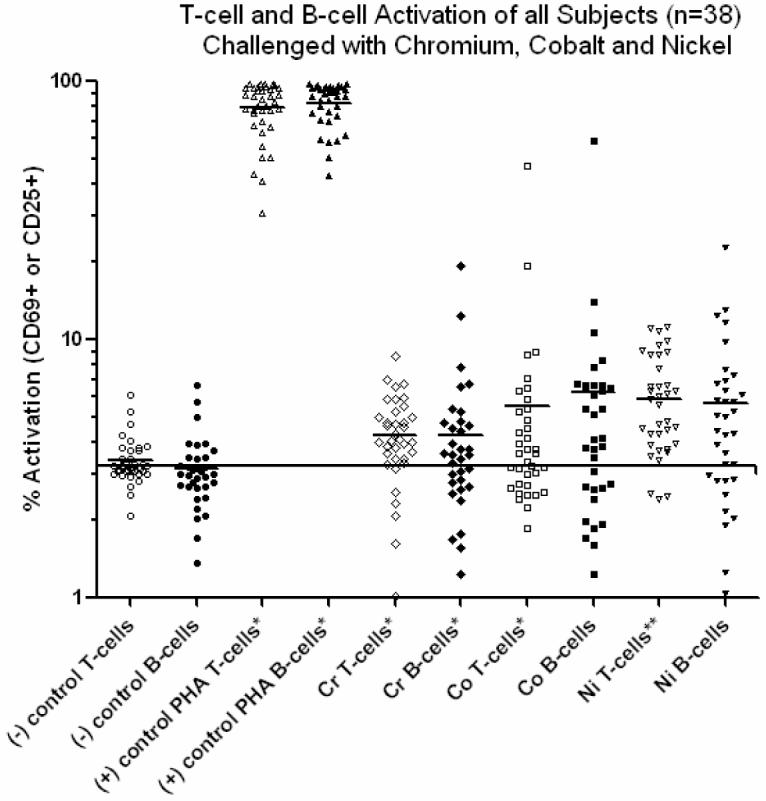
Figure 5.

All subjects activation values in responses to Cr, Ni and Co are shown, where an activation level >6% represented a >2 fold over unchallenged controls. The horizontal line represents the average of the control values, approx 3%. Reactivity to Cr, Co and Ni demonstrated levels of activation that were significantly above controls for both T-cells and B-cells. There were no significant differences in the elevated levels of reactivity to Cr, Co and Ni. Additionally, there were no intergroup (Group 1 vs. Group 2) differences in reactivity to the metal challenge agents (a lymphocyte mitogen). Note: An * = p<0.005, paired t-test compared to untreated controls. An ** = p<0.06, paired t-test compared to untreated controls.
