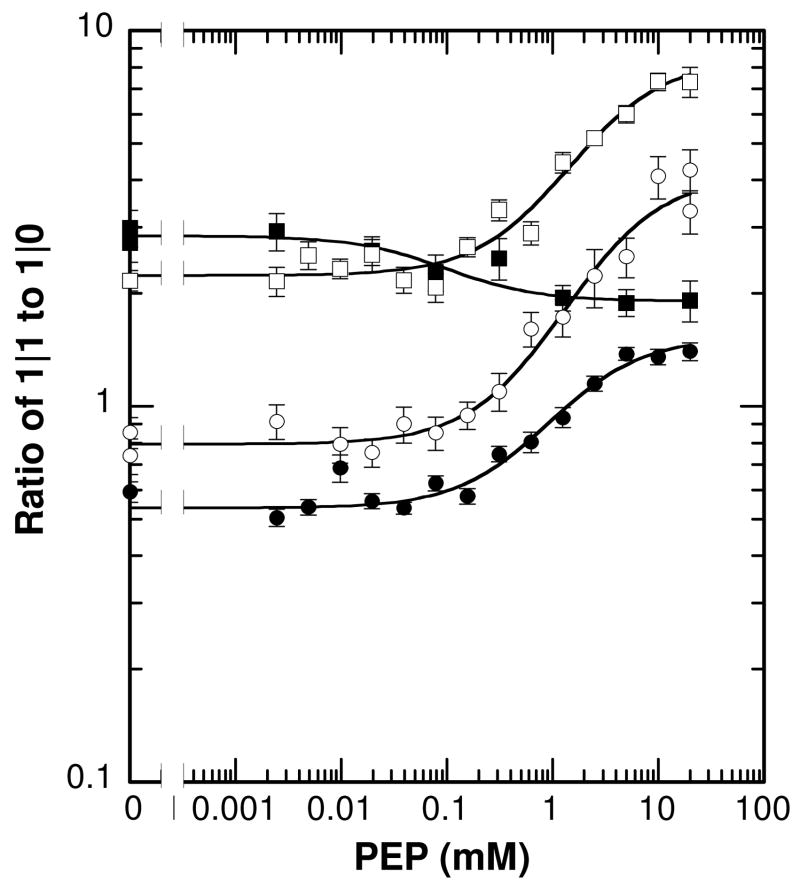
Figure 3.
Dependence of Km/kcat on PEP concentration for each of the individual heterotropic interactions: 45Å (λ), 33Å (■),30Å (□), and 23Å (○). Data are presented as the ratio of the data obtained with 1|1 constructs to the data obtained with the respective 1|0 control as described in the text. Error bars are present for all data points. Lines represent best fits to Equation 3 and the resulting parameters are listed in Table 1.

