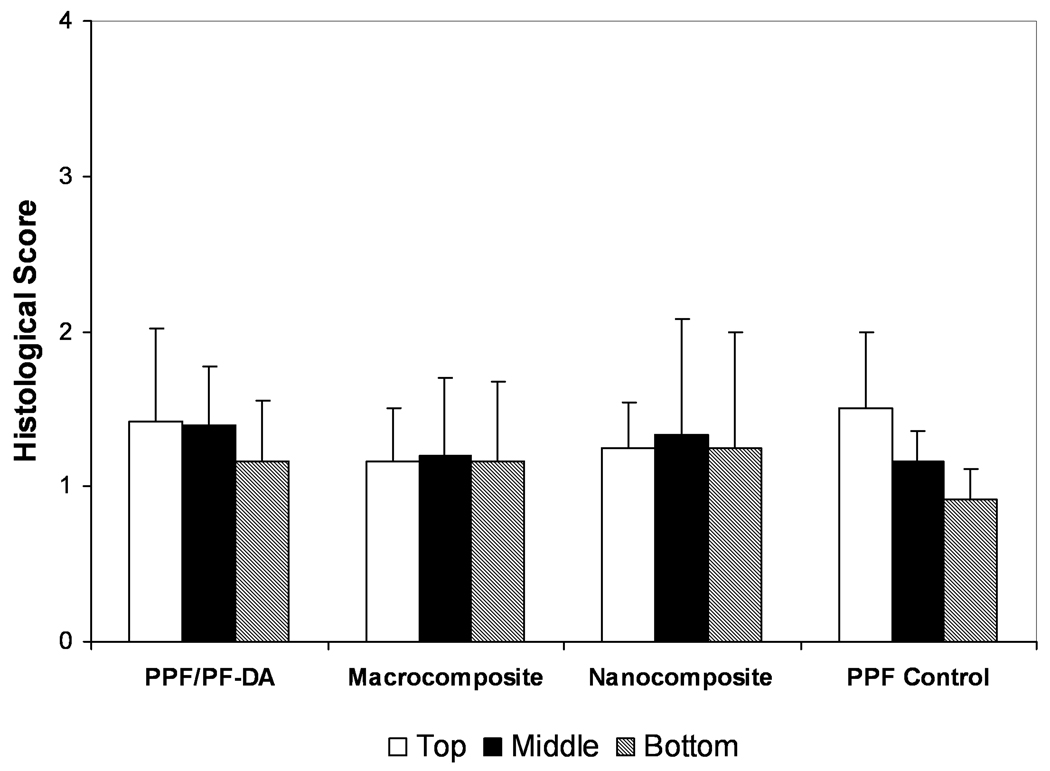
Figure 4. Histological scoring of bone growth within scaffold pores.
Histological scoring of bone ingrowth for each material group based on Table 1. Data presented as mean ± standard deviation for n = 3 – 6. No statistically significant differences were observed between material groups or regions (p > 0.05).

