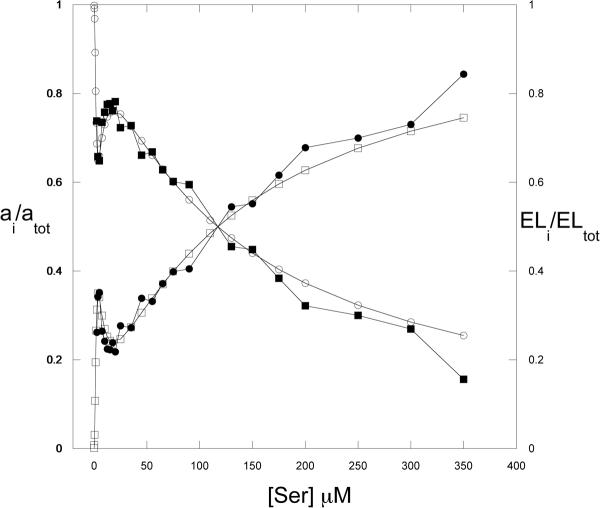
Figure 10. Amplitude Data from L-serine Binding to W139F-E360W PGDH.
The amplitudes derived from fitting the pre-steady state transients of L-Serine binding to W139F-E360W PGDH are plotted; aobs 1(■), aobs 2 (●). The data were modeled to the theoretical distribution of bound species for a 4 Step sequential binding mechanism based on Adair constants of 15, 0.5, 3, and 120. The theoretical distribution of species shown represents E + EL1 + EL3 (□) and EL2 + EL4 (○). In this case, L in the general equations refers to serine. The solid lines do not represent a fit to an equation, but simply connect the data points.

