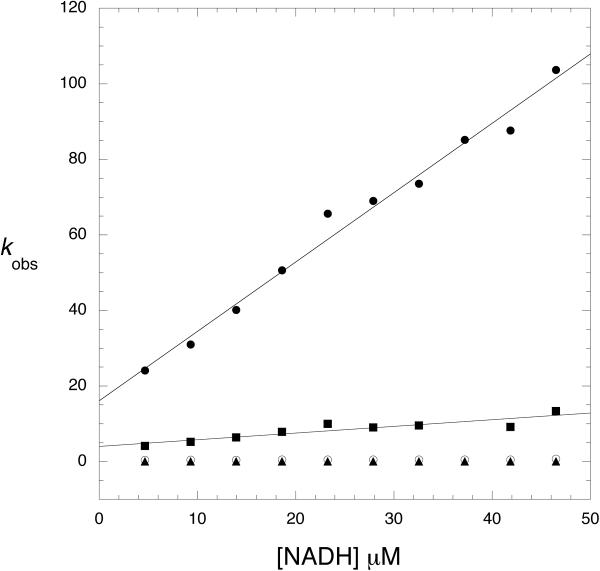
Figure 3. Observed Rates for NADH Binding to Native PGDH in the Presence of Satutrating Levels of L-Serine.
The observed rates (kobs) derived from the pre-steady state transients are plotted versus NADH concentration. kobs 1(●), kobs 2 (■), kobs 3 (○), kobs 4 (▲). The solid lines are fits of the data to equation 2. The protein concentration was 2.5 μM subunit.

