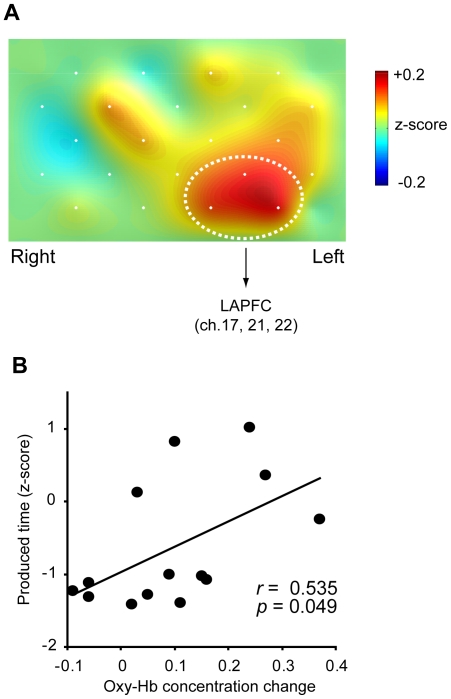
Figure 3. Change in hemodynamic response and functional correlation in prefrontal cortex (PFC) activity after sleep deprivation.
(A) Topographic image representing increased activation in the PFC on day 2 in the SD condition (n = 14). The image is constructed by using subtracted values between the SC and the SD conditions (SD minus SC). The area of dotted white circles emphasizes the left anterior PFC (LAPFC) including chs. 17, 21 and 22 for region of interest (ROI) analysis. (B) Correlation between normalized produced intervals and oxy-Hb concentration changes in the LAPFC ROI on day 2 in the SD condition (n = 14). Functional connectivity in changes of short-time perception with LAPFC activity under sustained wakefulness is suggested by a correlation coefficient (r) of 0.535 with statistical significance (p<0.05).

