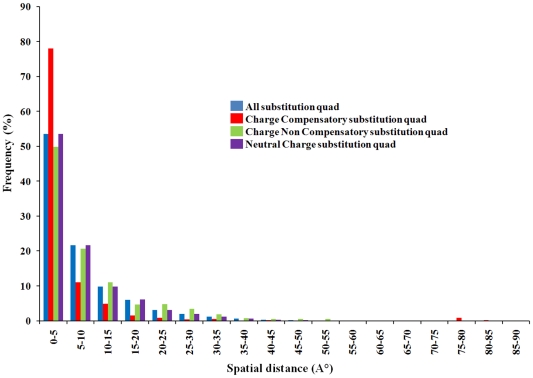
Figure 4. Charge compensatory substitutions within the coevolved sites.
Frequency of charge compensatory substitutions was calculated by counting the number of charge compensatory substitution quads (see Methods for details) for each pair of coevolved alignment columns. Frequency of charge compensatory substitutions (Y axis) is plotted against the spatial distances (X axis) between coevolved residue pairs.

