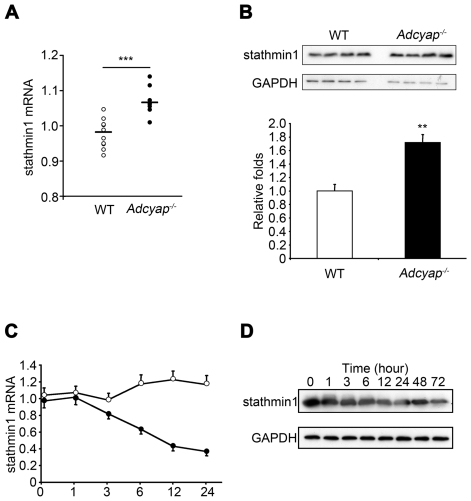
Figure 1. Stathmin1 expression is negatively controlled by PACAP.
(A, B) Comparison of stathmin1 expression of wild-type mice to that of Adcyap−/− mice. (A) Expression level of stathmin1 mRNA in DG was measured by real-time RT-PCR and normalized to the expression of GAPDH. Data represents means±SEM of independent experiments (wild type n = 10, Adcyap−/− n = 10, ***P = 0.0000496 compared with wild type). (B) Expression of stathmin1 protein in the DG of wild type and Adcyap−/− mice measured by western blot analysis (upper panel). GAPDH was used as internal control (middle panel). Lower panel shows the ratio of stathmin1 protein level in DG of Adcyap−/− mice (closed column) to that of wild-type mice (open column). Error bars represent ±SEM. (wild-type n = 4, Adcyap−/− n = 4, **P = 0.00277 compared with wild-type). (C, D) Kinetic studies of the effect of PACAP signaling on stahmin1 expression levels in PC12 cells. (C) Alteration of stathmin1 mRNA levels by the indicated period of PACAP (100 nM) stimulation was quantified by real-time PCR. Data are expressed as mean percentages ±SEM relative to control values at 0 h. Open circle indicates vehicle treatment. Closed circle represents PACAP treatment. (D) Alteration of stathmin1 protein levels under the indicated period of PACAP (100 nM) stimulation was measured by western blot analysis using an anti-stathmin1 antibody.

