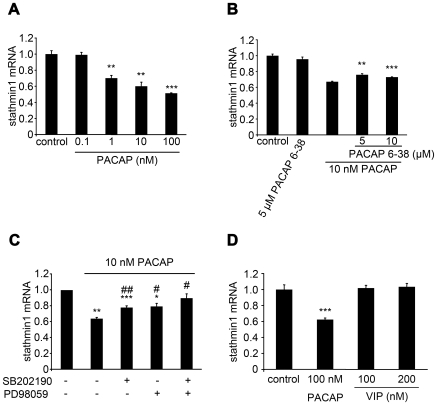
Figure 2. PACAP regulated stathmin1 expression via PAC1 in PC12 cells.
(A) Alteration of stathmin1 mRNA levels 24 hours after PACAP treatment, at indicated concentrations, was quantified by real-time PCR. Data are expressed as mean percentages ±SEM relative to control values (n = 3, PACAP 1 nM **P = 0.0044, 10 nM **P = 0.0033, 100 nM ***P = 0.0003 compared with control). (B, C) Effect of PACAP signaling pathway inhibitors on the PACAP-induced down-regulation of stathmin1 expression. (B) PC12 cells were treated with 10 nM PACAP for 6 h and incubated with or without the indicated concentration of PAC1/VPAC2 receptor antagonist, PACAP 6-38 (n = 3, PACAP6-38 5 µM **P = 0.0027, 10 µM ***P = 0.00045 compared with PACAP stimulation alone) and (C) pretreatment of either ERK or p38 inhibitor (n = 3, PACAP stimulation alone **P = 0.0012, SB202190 ***P = 0.0008, ##P = 0.005, PD98059 *P = 0.018, #P = 0.0018, SB202190 & PD98059 #P = 0.013, *compared with each control, #compared with PACAP stimulation alone). Then stathmin1 expression was quantified by real-time PCR. Data are expressed as mean ratios ±SEM relative to control values. (D) Alteration of stathmin1 mRNA levels in PC12 cells, 6 hours after PACAP or VIP treatment at the indicated concentrations, was quantified by real-time PCR. Data are expressed as mean percentages ±SEM relative to control values (n = 3, PACAP 100 nM ***P = 7.08E−07 compared with control).

