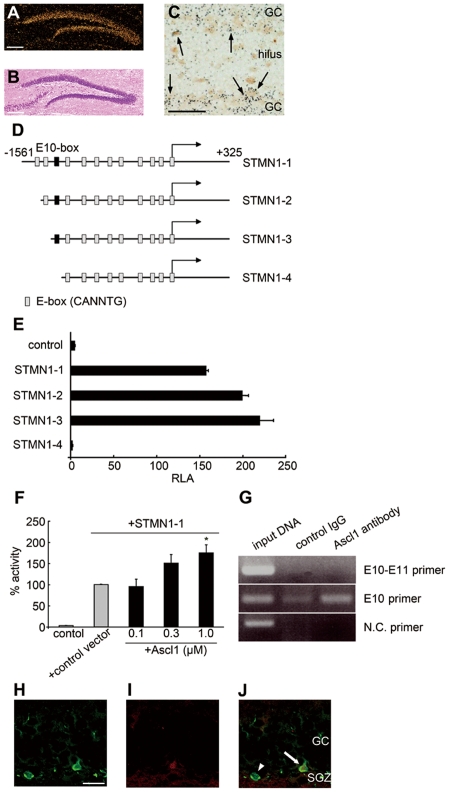
Figure 5. PACAP inhibits stathmin1 by up-regulation of Ascl1 using p38 and ERK signals.
(A) Localization of stathmin1 and PAC1 expressing neurons in the DG of wild-type mice. (B) Hippocampal section stained with hematoxylin and eosin. Bars = 100 µm. (C) shows the localization of stathmin1 and PAC1 expressing neurons in the same section (arrows). Stathmin1 is visualized by immunohistochemistry (brown) and PAC1 mRNA by in situ hybridization (black grains). Bars = 50 µm. (D–J) Involvement of Ascl1 in the promoter activity of stathmin1. (D) Schematic diagram of the 1.8 kb rat stathmin1 5′ genomic DNA fragments for the luciferase activity assay. These vectors posses the 5′ regulatory region of stathmin1, the first exon and partial sequence of the first intron. The different promoter constructs used in this study are shown. The relative location (not drawn to scale) of putative E-boxes, and the transcription start site (arrow at +1) are shown. (E) PC12 cells were transfected in 6-well plates with the indicated stathmin1 promoter-luciferase plasmids and the Renilla luciferase plasmid. Firefly and Renilla luciferase activities were measured using a Dual Luciferase Reporter Assay System (n = 3). Luciferase activity was measured and data (means±SEM) are shown as relative luciferase activity (RLA). (F) Activation of the STMN1-1 promoter by Ascl1. STMN1-1 plasmid and 1 µg of expression vector, which are mixed with empty vector pCI and the indicated amounts of pCI-Ascl1, were transfected in triplicate, with 0.2 µg. 48 h after PC12 cell transfection, the cells were collected and the RLA was determined. Data (mean±SEM) show representative results of least three experiments, *P = 0.0165. (G) Sheared chromatin from PC12 cells was immunoprecipitated with the appropriate antibody (anti-Ascl1, control rat anti-IgG). Then DNA sequences bound to precipitated proteins were isolated. Immunoprecipitated DNA was used as template in PCR using E10 primers, E10–E11 primers or negative control primers. (H–J) Localization of stathmin1 (H) and Ascl1 (I) were demonstrated on the same DG section of wild-type mice. Arrows indicate SGZ neurons containing both stathmin1 and Ascl1. Arrow head represents a neuron expressing stathmin1 alone. Bar = 10µm.

