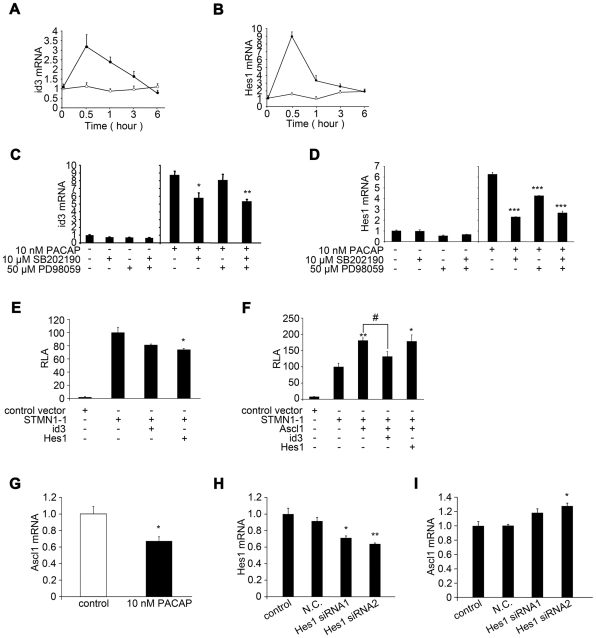
Figure 6. Hes1 and Id3, which are regulated by PACAP, inhibit Ascl1 function.
(A, B) Kinetic study of the effect of PACAP on the expression of Id3 (A) and Hes1 (B) mRNA. PC12 cells were treated with 10 nM PACAP for the indicated times and Id3 and Hes1 expression was quantified by real-time PCR. Data are expressed as mean percentages ±SEM relative to control values at 0 h. Open circle indicates vehicle treatment. Closed circle represents PACAP treatment. (C, D) Up-regulation of Id3 expression was inhibited by treatment with a p38 inhibitor (SB202190) (n = 3, SB202190 *P = 0.0202, SB202190 & PD98059 **P = 0.0032 compared with control) (C), and expression of Hes1 mRNA was inhibited by treatment with p38 (SB202190) and ERK (PD98059) inhibitors (n = 3, SB202190 ***P = 1.68×10⁻⁵, PD98059 *** P = 0.000252, SB202190 & PD98059 *** P = 8.98×10⁻⁵ compared with control) (D). PC12 cells were incubated with each inhibitor for 1 h, then treated or not with 10 nM PACAP for 0.5 h. Id3 and Hes1 expression were quantified by real-time PCR. Data are expressed as mean ratios ±SEM relative to control values for inhibitor alone. (E) Effect of over-expression of Id3 or Hes1 on the promoter activity of stathmin1. PC12 cells were transfected with STMN1-1 promoter-luciferase plasmid alone or with Id3 expression plasmid, pCI-Id3 or Hes1 expression plasmid, pCI-Hes1. Co-transfection of Id3 or Hes1 expression plasmids inhibited the activity of STMN1-1 promoter plasmid (n = 3, +pCI- Id3 P = 0.0743, +pCI-Hes1 *P = 0.0305 compared with +control vector). (F) Id3, but not Hes1, inhibited the activity of STMN1-1 promoter increased by co-transfection of Ascl1 expression plasmid, pCI-Ascl1 (n = 3, +pCI-neo +Ascl1 **P = 0.00385, +pCI-Hes1 +Ascl1 *P = 0.025 compared with +pCI-neo, +pCI- Id3 +Ascl1 # P = 0.0454 compared with +pCI-neo +Ascl1). (G) The effect of PACAP on the expression of Ascl1 mRNA in PC12 cells. Ascl1 expression was quantified by real-time PCR (n = 3, *P = 0.048 compared with control). Data are expressed as mean percentages ±SEM relative to control. (H, I) Effects of down-regulation of Hes1 on the expression level of Ascl1 mRNA. The effect of siRNAs for Hes1 are shown in (H) (n = 3, siRNA1 *P = 0.0159, siRNA2 **P = 0.00636 compared with control). The expression level of Ascl1 was quantified by real-time PCR (n = 3, siRNA1 P = 0.076, siRNA2 *P = 0.0162 compared with control). Data are expressed as mean ratio ±SEM relative to control values.

