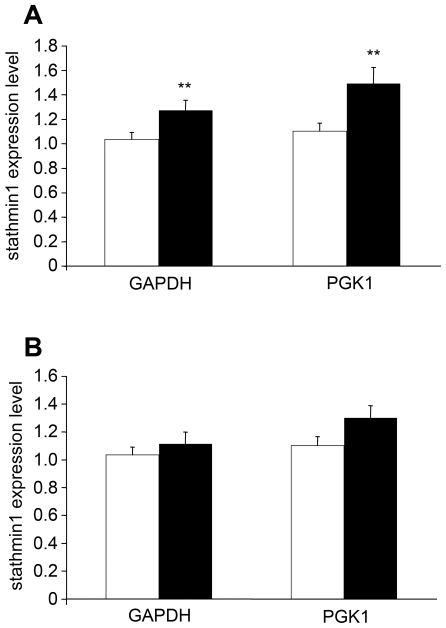
Figure 7. Expression of stathmin1 is increased in the brain of schizophrenia patients.
Comparison of mRNA levels of stathmin1 in the postmortem brain of control subjects (open column) and schizophrenia subjects (closed column) (A), or bipolar disorder subjects (B). The relative expression levels of the gene, normalized to GAPDH or PGK1, are presented. The expression of stathmin1 normalized to GAPDH (Mann-Whitney test, p = 0.0082) and PGK1 (Mann-Whitney test, p = 0.0047) were significantly increased in the schizophrenia group, compared with the control group.

