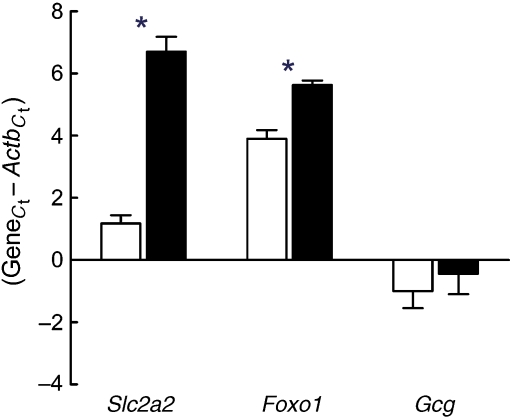
Fig. 2.
Enrichment of selected islet genes in LCM samples. mRNA expression genes was determined by quantitative TaqMan RT-PCR for each gene and for Actb from LCM islets (white bars) and total pancreas (black bars) of 8-week-old mice. Expression levels are presented as change in C t or the cycle number of each gene subtracted from the cycle number of beta-actin (C t value 20.15) for the same cDNA sample. Lower numbers thus correspond to higher expression. Data are means ± SE from five CHF-fed NZL mice. *p ≤ 0.05

