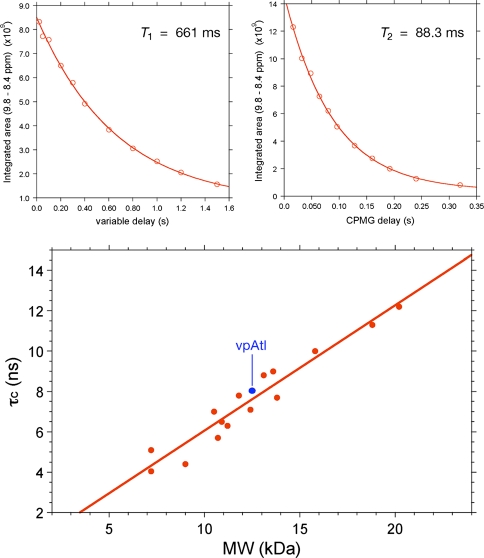
Fig. 8.
15N T 1 and T 2 relaxation data for [U-5%-13C, U-15N] vpAtl (NESG ID, VpR247). The data were acquired on a Bruker AVANCE 600 MHz spectrometer with 1.7 MicroCryoprobe at 25°C using pseudo-2D 15N T 1 and T 2 gradient experiments. T 1 spectra were acquired with delays, T = 20, 50, 100, 200, 300, 400, 600, 800, 1,000, 1,200 and 1,500 ms, and a relaxation delay of 3 s. T 2 spectra were acquired with CPMG delays, T = 16, 32, 48, 64, 80, 96, 128, 160, 192, 240 and 320 ms, and with a relaxation delay of 1.5 s. (Top): 15N T 1 and T 2 values were extracted by plotting the decay of integrated 1HN intensity between δ ≈ 8.4 to 9.8 ppm and fitting the curves with standard exponential equations using the program ‘t1guide’ within Topspin2.1 (Bruker BioSpin). (Bottom): Plot of τc versus protein molecular weight for known monomeric NESG targets of ranging size (taking into account isotope enrichment as well as affinity tags in the sequence). 15N T 1/T 2 data for all monomeric proteins used for the τc versus MW plot (red) were obtained on the same Bruker 600 MHz spectrometer at 25°C, and analyzed as described above. Using this approach, we obtain a τc of 8.0 ns for vpAtl (blue), which is consistent with a monomer

