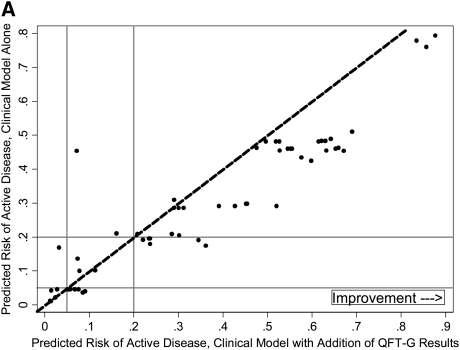
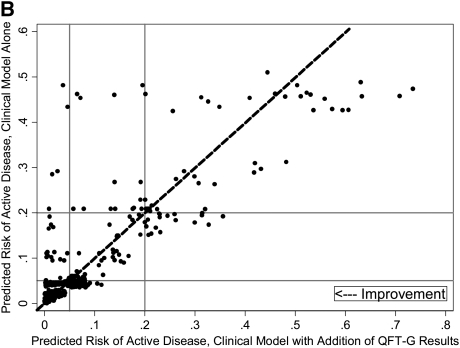
Figure 2.
(A) Changes in predicted risk of active disease following incorporation of quantitative IFN-γ results, cases. (B) Changes in predicted risk of active disease following incorporation of quantitative IFN-γ results, noncases. Dashed diagonal lines represent no change in risk prediction with addition of quantitative IFN-γ results. Among culture-proven cases, individuals to the right of the dashed diagonal line indicate higher (and therefore improved) risk prediction, and those to the left indicate lower (and therefore worse) risk prediction; these criteria are reversed for noncases. Horizontal and vertical solid lines indicate lower (5%) and upper (20%) risk cut points.


