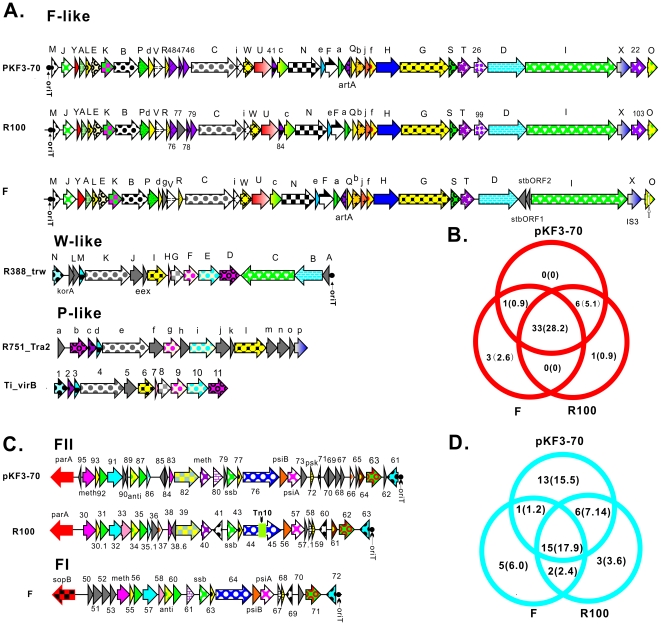
Figure 3. Comparative genomic analysis of conjugation and transfer leading regions of pKF3-70 and other plasmids.
(A,C) show 6 conjugation regions and 3 transfer leading regions of plasmids from different incompatibility groups, respectively. Homologous genes are shown using arrows with the same color/pattern except for arrows in gray, which indicate genes without homology. The name of each gene is provided above or below. In conjugation regions of the 4 plasmids pkF3-70, R100, F and R751, tra genes are named in corresponding capital single letters, while trb genes are in the lowercase single letters. trw genes in R388 are marked using corresponding lowercase single letter. Numbers 1–11 in the Ti conjugation region represent corresponding VirB genes. The leading region arrows are marked using ORF or gene names. Red frame in R100 of Fig. 3C shows the transposon Tn10. (B,D) show statistics for homologous genes in conjugation regions and transfer leading regions, respectively. Numbers in brackets indicate the percentage. Except for the sequence of pKF3-70, plasmid gene information was retrieved from GenBank (accession numbers, R100: AP000342; F: NC_002483; R388: BR000038; R751: NC_001735; Ti: NC_002377.).

