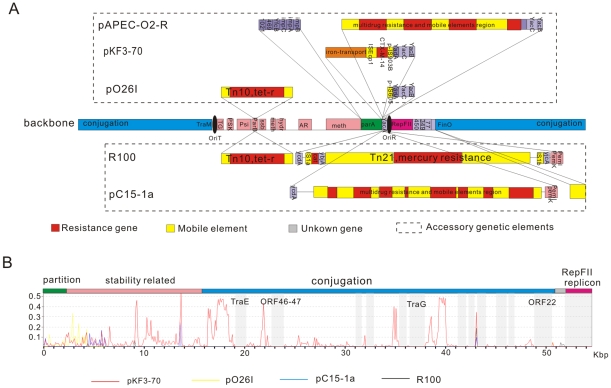
Figure 7.
(A) R100 backbone and accessory genetic elements on different plasmids. (B) Mutation rates profile of the four plasmids along the backbone sequences. Longitudinal coordinate represents mutation rates and horizon coordinate represents position in backbone sequences. This analysis use slide window of 100 bp. Red line: pKF3-70; yellow line: pO26I; blue line: pC15-1a; black line: R100. Region with shallow grey background was absolutely identical in all four plasmids and genes in the identical regions were marked.

